

From dashboards to strategy: a practical comparison of today’s leading BI tools and how to pick the right one.
Ever stared at spreadsheets and thought, “There has to be a better way to see all this data?” Picking the right Business Intelligence (BI) tool can feel like that, one wrong move, and teams are drowning in numbers that don’t tell a story. Power BI, Tableau, and Looker; each promises clarity, but none are plug-and-play magic. Organizations struggle with fragmented data, missed insights, and the constant worry that decisions are based on guesswork. Outsourcing some of the BI workload can help here, bringing expertise and speed without overloading internal teams.
In this blog, the aim is to untangle the confusion. We’ll dive into a BI Tool Comparison, break down Power BI vs Tableau vs Looker, explore the benefits and challenges of each, discuss strategies to pick the right fit, peek at future trends, and see how outsourcing can amplify results.
BI Tools: Turning raw numbers into actionable insights
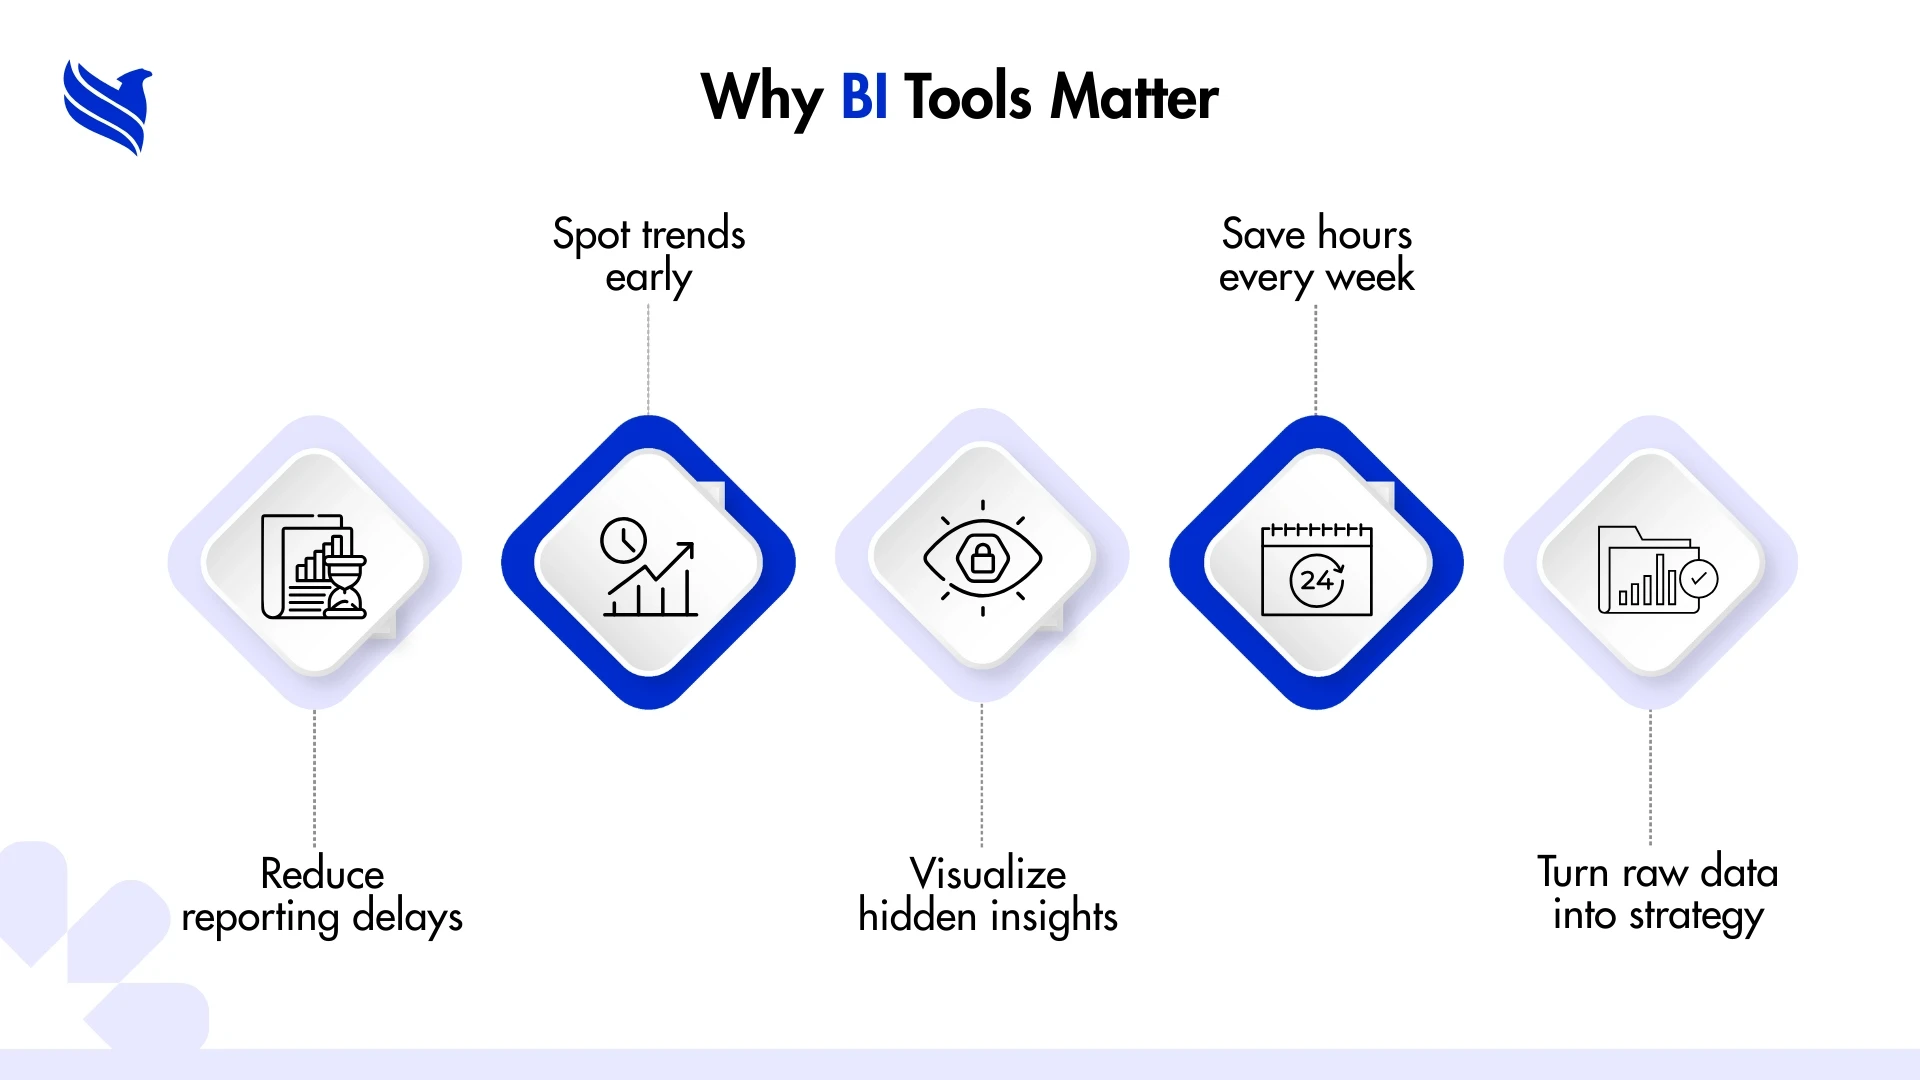
At its core, a BI tool isn’t just software, it’s a magnifying glass for your business. These tools help make sense of the overwhelming flood of raw data, turning numbers into dashboards, charts, and trends that anyone can read. Companies use BI tools and platforms to track performance, forecast trends, and make decisions that are grounded in evidence, not guesswork.
For instance, imagine tracking sales across 50 regions. Without a BI tool, it’s scattered reports and endless Excel pivot tables. With one, it’s a live view of what’s actually happening, accessible to everyone who needs it. And when businesses lean on Business Intelligence Services, they gain not just the tool but the expertise to interpret data efficiently, so insights don’t sit idle.
The right BI platform also improves communication. When leadership can see the same data in a clear visual way as the operations team, decisions happen faster. It’s why more companies are exploring business intelligence outsourcing to scale expertise without adding headcount.
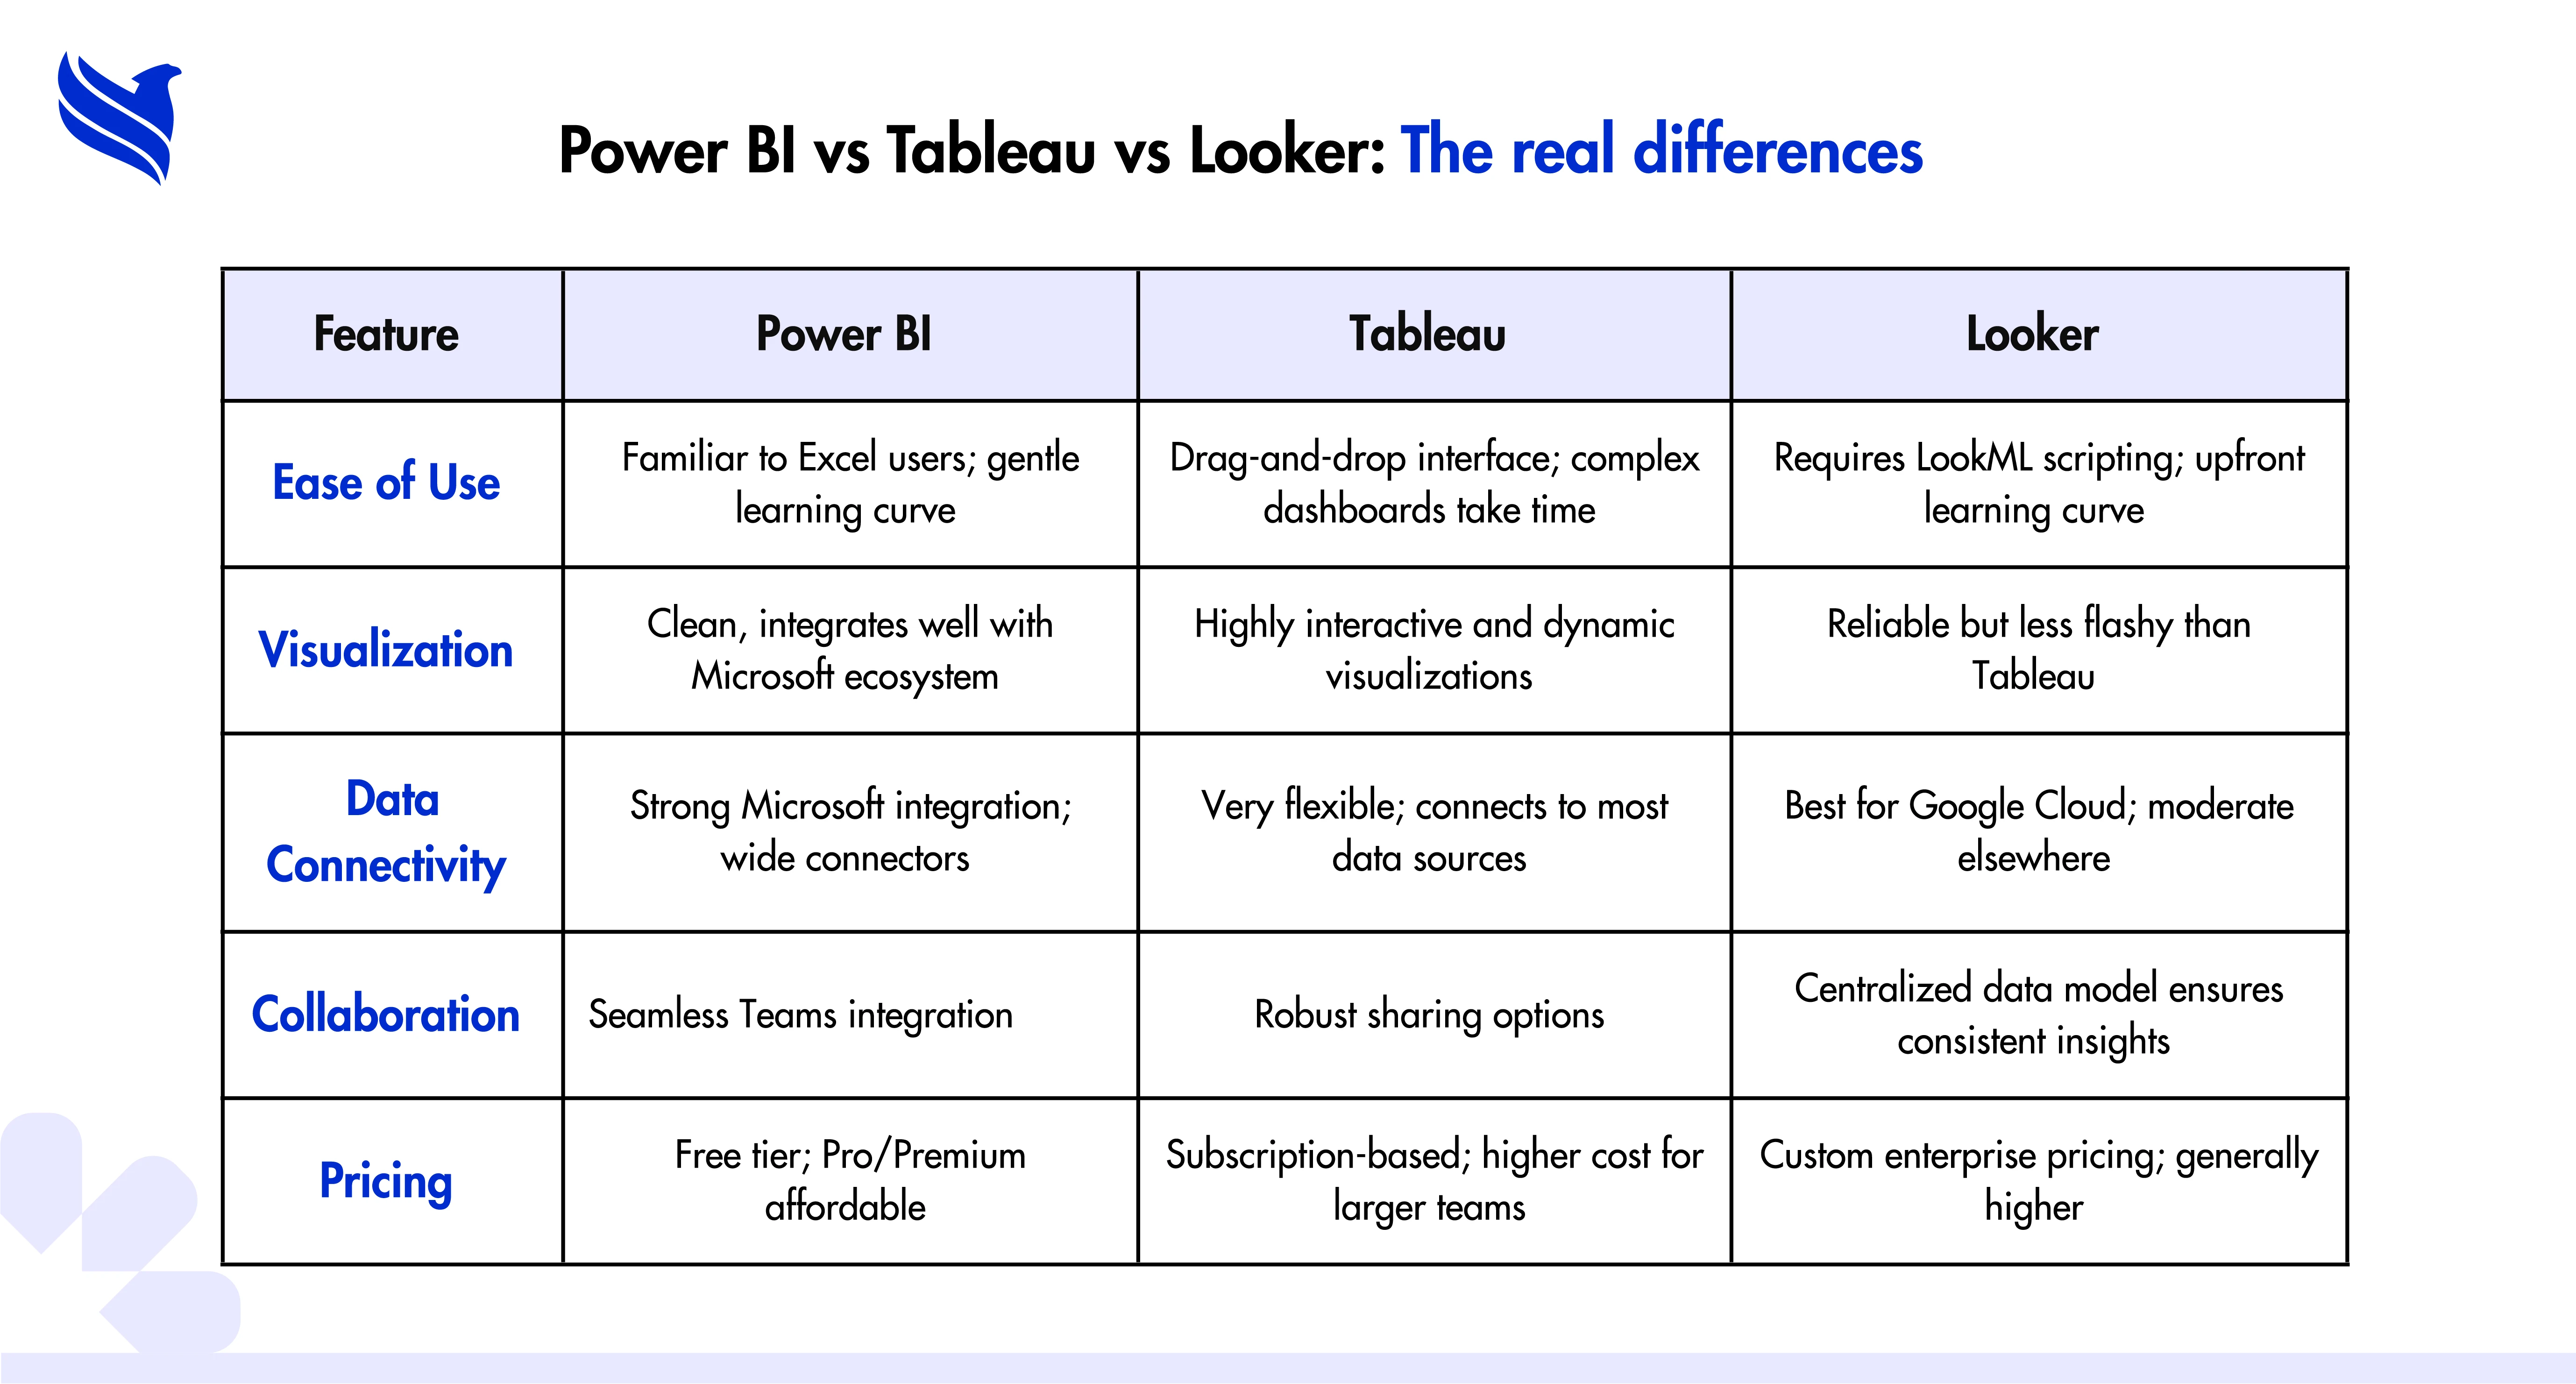
Power BI vs Tableau vs Looker: The real differences
Each BI tool has its personality, strengths, and quirks. Here’s a comparative analysis:
Power BI: Practical Usage
Power BI often shines in mid-size businesses or organizations already using Microsoft products. It’s straightforward for teams familiar with Excel. Picture a finance department that needs monthly reports pulled from multiple systems, Power BI can automate this, saving hours of manual work. It also scales well with minimal overhead. But if your team wants super-fancy visuals or highly interactive dashboards for storytelling, Power BI may feel limited.
Tableau: Practical Usage
Tableau is the “artsy” option. Analysts love it because it can create visually stunning dashboards and explore data from multiple angles. Imagine a marketing team trying to visualize campaign ROI across dozens of channels, they can drag, drop, filter, and see correlations that would be invisible in spreadsheets. The downside? Tableau can be expensive, and creating complex dashboards requires expertise. Beginners often underestimate the learning curve.
Looker: Practical Usage
Looker is built for companies with centralized data governance and standardized reporting. Tech-heavy organizations that rely on Google Cloud love it. Think of a SaaS company wanting every department to see the same KPIs in real-time, the centralized model ensures consistency. On the flip side, LookML scripting can be a hurdle, so onboarding takes longer, and casual users might feel lost at first.
Real-world use often blends tools. Some companies use Power BI for quick reporting, Tableau for rich visualization, and Looker for governance. The key is matching tool strengths to business needs rather than chasing trends and making the most common BI dashboard mistakes in BI. Without proper knowledge even the best tool won’t help if dashboards are cluttered, poorly structured, or disconnected from business objectives.
Strategies for Choosing the Right BI Tool
Choosing the right BI tool for your business isn’t about checking feature lists, it’s about context, culture, and scalability. A few strategies that matter:
- Understand Business Needs: Are you a small team that needs quick dashboards or a large enterprise requiring multi-source analytics?
- Integration Matters: Does the tool play nicely with your CRM, ERP, or cloud storage? Manual exports kill productivity.
- Skill Levels: Some tools demand technical expertise, others are plug-and-play. Matching to your team matters.
- Scalability: Your tool should grow with you. Nothing worse than hitting limits right when data becomes most critical.
- Budget and ROI: Fancy features are meaningless if no one uses them. Focus on what will actually improve decision-making.
Adding automation is often overlooked. Platforms now let teams automate reporting, send alerts, and generate predictive insights. Tapping into BI automation tools helps companies get these benefits quickly without overloading IT. A missed alert or delayed report can cost money, outsourcing specialists ensure this doesn’t happen.
Future Trends in BI Tools
The BI world is evolving fast. Some trends shaping the future:
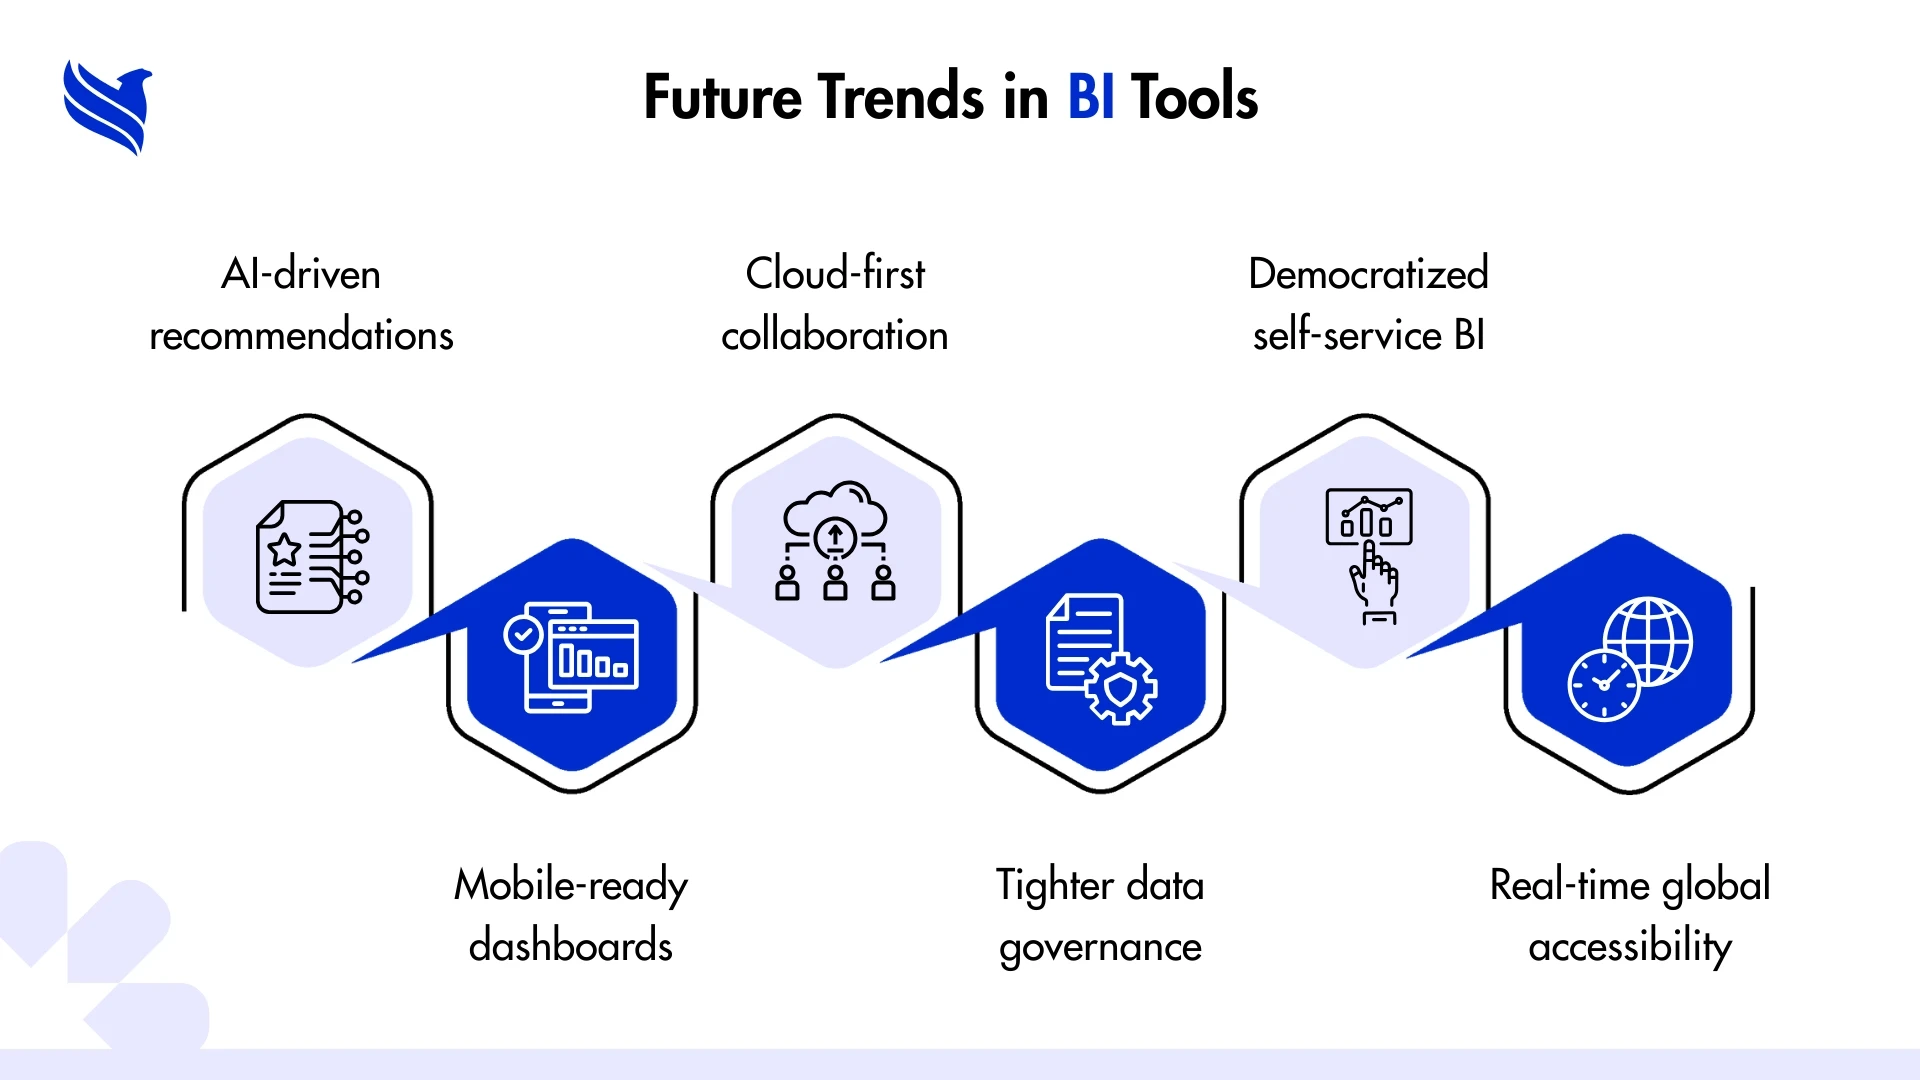
- AI-Powered Insights: Tools now suggest trends or anomalies automatically. For instance, Power BI can highlight unexpected changes in metrics without manual checks.
- Cloud-First Platforms: Real-time collaboration is easier than ever. Tableau Online or Looker make dashboards accessible from anywhere.
- Self-Service BI: Users can build dashboards without IT. This democratizes insights but requires careful governance.
- Mobile BI: Business decisions often happen on the go. Apps for tablets and phones let leaders act fast.
- Data Security & Governance: With regulations tightening, BI platforms now offer stronger compliance features.
These trends influence the choice between Power BI, Tableau, and Looker, but again, context is key. A flashy AI dashboard doesn’t help if your team can’t interpret it.
How outsourcing can make BI tools work harder
Owning a BI tool is one thing; using it effectively is another. Outsourcing can close that gap.
Imagine a scenario: a retail chain implements Tableau, but internal staff are too busy to build dashboards or clean data. Outsourced teams can step in, design meaningful dashboards, automate reports, and maintain data hygiene. This also speeds up adoption because insights are ready when teams need them.
Outsourcing partners provide customized BI solutions, tailored dashboards, and predictive analytics. They bring experience across multiple industries, helping avoid common pitfalls and maximize ROI.
Furthermore, outsourcing can be a cost-efficient way to scale. Instead of hiring multiple analysts or IT staff, an external team manages setup, maintenance, and optimization. It’s not about giving up control, it’s about amplifying capabilities, reducing errors, and freeing internal teams for strategy, not grunt work.
Making analytics work for you
Choosing a BI tool is more than a tech decision, it’s strategic. Power BI, Tableau, and Looker each have strengths, quirks, and best-use scenarios. Matching tool capabilities with business needs, user skill levels, and growth plans ensures that data becomes a true decision-making ally, not just a fancy report.
Keeping an eye on automation, mobile access, AI integration, and governance future-proofs your investment. And outsourcing the setup or management ensures dashboards are meaningful, insights actionable, and analytics aligned with strategy.
At FBSPL, Business Intelligence Services cover everything from selecting the right platform to deploying dashboards, integrating data, and maintaining predictive analytics. Choosing the right BI tool is hard, having experts guide the way makes it achievable.
Contact FBSPL to see how tailored BI solutions can empower teams, simplify reporting, and help your business make smarter, faster choices.