
8 MIN READ/Aug 01, 2025

If you can’t see it, you can’t fix it. That’s the brutal truth leaders are waking up to across boardrooms. Today’s markets don’t wait for perfect reports or long meetings. They move fast. And for CEOs and CFOs carrying the weight of payrolls, forecasts, and investor expectations, decisions can’t be made in the dark.
This is where the executive dashboard stops being a nice-to-have and becomes mission-critical.
We're not talking about those massive Excel sheets no one opens after the meeting. We're talking about dashboards built for clarity, tools that pull live data and tell you, at a glance, whether you're heading for a win or sleepwalking into trouble.
Every decision leaves a ripple, through revenue, staffing, operations, and investor confidence. A dashboard, when done right, doesn’t just show performance, it spots risk before it spreads. It connects the dots across departments. And most importantly, it keeps leaders grounded in what’s real, not what’s reported weeks too late.
This blog unpacks what that actually looks like. What CFO key performance indicators truly matter. How the right dashboard works beneath the surface. The different types of executive dashboards worth considering. And why, in many cases, outsourcing business intelligence can be the fastest way to build a dashboard that isn’t just smart, it’s useful.
If you’ve ever looked at your reports and thought, “This still doesn’t help me decide,”, this one’s for you.
There’s a difference between a pretty chart and a decision-making tool. Most executives already know this. But too often, CFO dashboards still get built for aesthetics instead of answers.
A real dashboard doesn’t care about colors or widgets. It cares about questions like:
That’s what a good CFO wakes up thinking about. And a real CFO dashboard? It answers those questions in real time, without having to chase reports or ask five people for numbers.
So how does a CFO dashboard work beneath the hood?
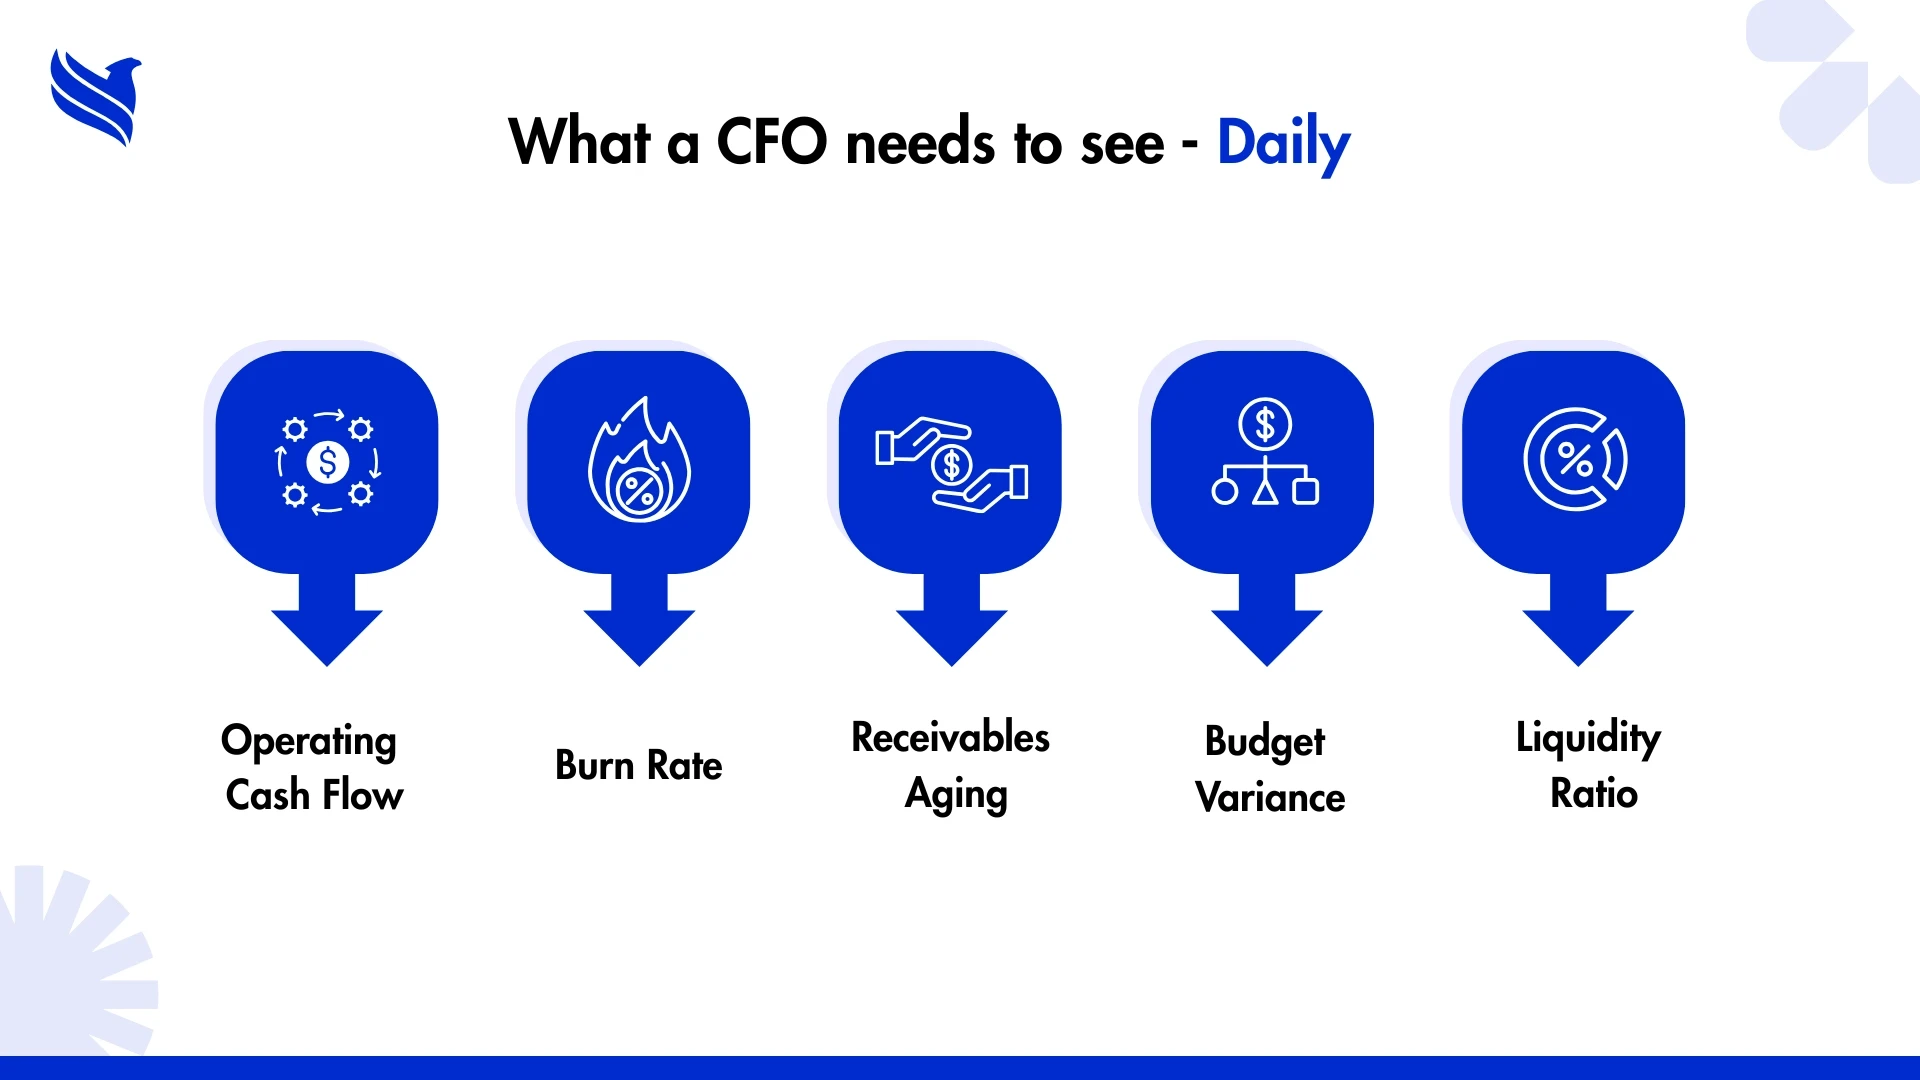
It connects. It pulls live data straight from your core systems, accounting software, ERP, CRM, payroll, operations platforms. Then it funnels that raw data into a curated set of CFO dashboard KPIs that actually mean something: EBITDA, operating cash flow, receivables aging, quick ratios, budget variance, and more.
But the numbers alone don’t cut it. What separates the dashboards that get used from the ones that collect dust?
Think of it like this: a proper CFO dashboard is a pulse monitor. If the numbers look off, you don’t guess. You investigate. Fast.
More and more, CFOs are ditching generic tools and building dashboards that work for them, not against them. Because the truth is, nobody has time to “make sense” of a dashboard. It needs to make sense right away, or it’s already failed.
It’s easy to think of executive dashboards as one uniform tool, but the truth is, they come in several flavors, each one designed for a different battle.
Let’s break down the types of executive dashboards that actually show up in high-functioning companies:
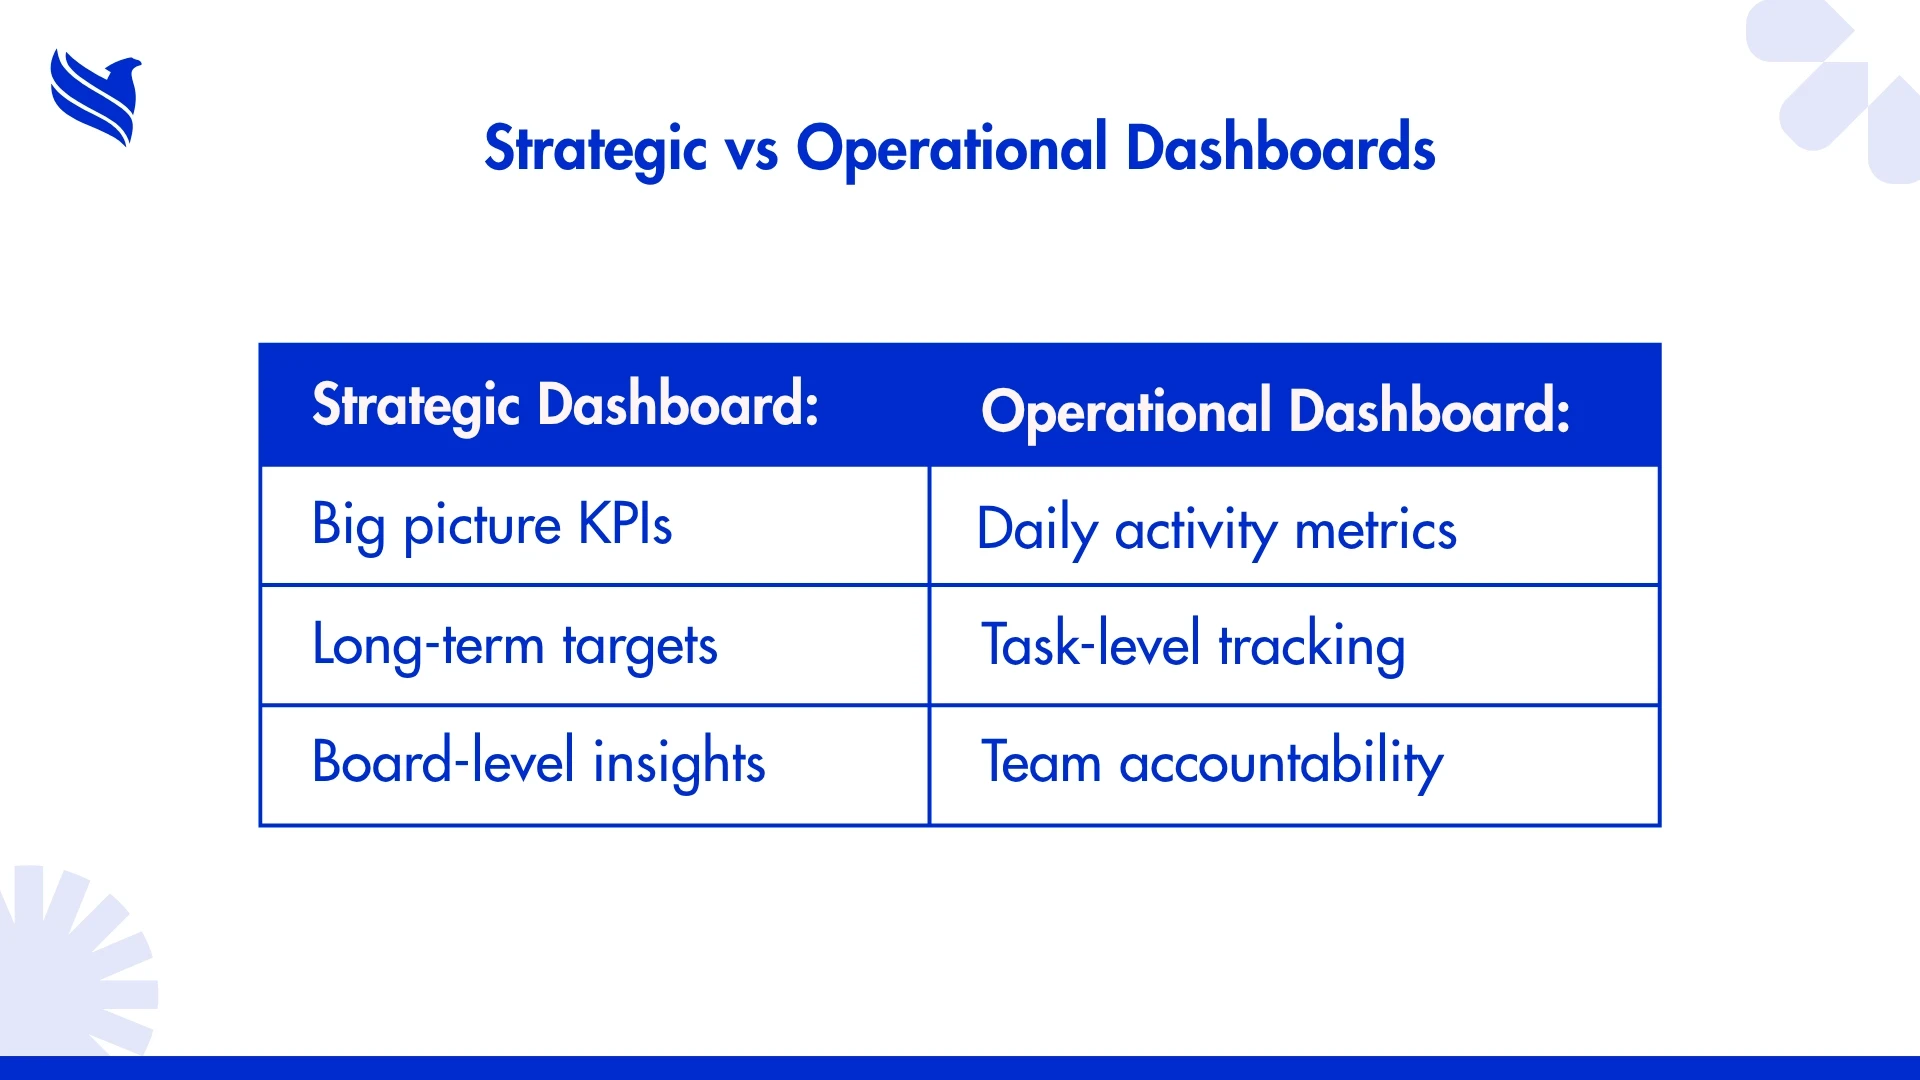
Think long-term performance. These dashboards offer a high-level view into business goals, year-over-year trends, and executive KPIs. Perfect for board meetings or quarterly reviews.
These go deeper into day-to-day processes—tracking metrics like order fulfillment times, support ticket resolution rates, production efficiency, and more. Great for department heads but useful for CEOs who want to stay close to execution.
Built for deep dives. These dashboards aren’t just about real-time; they focus on pattern recognition and predictive analytics. CFOs use these to model different scenarios and prep for risk mitigation.
Focused on short-term projects or campaigns. They help answer: “Is the new pricing model impacting churn?” or “How did last month’s paid campaign affect inbound leads?”
Depending on your role, and your industry, you might need a hybrid model. But what’s non-negotiable is clarity. Every dashboard, no matter the type, should be intuitive enough for a 2-minute scan and powerful enough to drive million-dollar decisions.
Ask any CFO and they'll tell you: it's not about more data, it’s about the right data. A bloated dashboard with 50 metrics is useless if only 5 are being used in decisions. Below is a tight list of CFO key performance indicators that belong on every high-functioning CFO dashboard KPI layout.
Shows how actuals are lining up with the plan. Misses are red flags; overperformance needs allocation strategy.
Not just profit, but real liquidity in motion. Helps detect cracks in working capital.
Critical for startups and scale-ups. Understand how quickly cash reserves are depleting.
A no-BS view of core profitability without noise from tax structures or one-time items.
Cash stuck in AR kills momentum. This KPI tells you how fast customers are paying up.
Indicators of how comfortably you can cover short-term liabilities. CFOs watch these like hawks.
Risk insight in one line. High ratios may worry investors; low ratios may indicate under-leverage.
Are departments blowing through spend? This metric keeps everyone accountable.
And here’s the kicker; not all these KPIs need to be front and center 24/7. But they do need to be visible when decisions are on the table. Executive dashboards must allow flexibility to focus in or zoom out depending on the moment.
Here's something no spreadsheet can offer: real-time context.
That’s the real importance of executive dashboards, they give leadership a pulse on the business without waiting for the finance team to cook up a report every Friday. In fast-moving markets, timing is leverage. Dashboards allow leaders to:
In one client case we saw, the CEO didn’t realize their CAC (Customer Acquisition Cost) had spiked 27% month over month until their dashboard alerted them. It led to an immediate freeze on paid ads and a reallocation to organic channels. That kind of quick pivot? It doesn’t happen without real-time visibility.
And for CFOs, dashboards eliminate the chaos of scattered reporting. Instead of chasing data, they can analyze it.
For a deeper breakdown on how BI connects the dots across reporting, metrics, and action, check out this breakdown: The Power of Data Management and Reporting. It’s a sharp dive into how business intelligence goes beyond surface-level analytics to drive actual outcomes.
Not every company has an internal analytics army, and that’s okay. In fact, more smart leaders are choosing to outsource business intelligence than ever before.
Why? Because building dashboards that work isn’t just about plugging into Power BI or Tableau. It’s about:
External BI partners come in with cross-industry experience. They’ve built dashboards for fintechs, healthcare firms, SaaS startups, and old-school manufacturers. That perspective helps avoid tunnel vision.
Plus, outsourcing removes internal politics from the setup process. The goal isn’t to please departments; it’s to help leaders see clearly.
At FBSPL, for example, we’ve worked with dozens of mid-market firms struggling to make sense of their reports. Once we step in, the first priority is simplification: Cut the noise, align data sources, and surface the metrics that move the needle.
Dashboards aren’t just reports. They’re survival kits.
If you’re still treating dashboards like decoration, something to show off in board meetings, you’re missing the point.
Executive dashboards are decision tools.
They help CEOs sleep at night and give CFOs the edge in high-stakes meetings. But only when they’re done right. Not too busy. Not too vague. Not too late.
It starts with choosing the right KPIs, continues with using the right structure, and often succeeds when you hand the job to people who live and breathe business intelligence.
Don’t let your next big decision rest on outdated numbers or guesswork.
Want help building an executive dashboard that actually works?
FBSPL can deliver what off-the-shelf tools and internal reporting teams often can’t, clarity, focus, and action-ready dashboards.
Book a free consultation and see what a real BI can do for your business.
Insights and analysis from our industry experts.