
Business intelligence vs traditional reporting: Key differences, benefits & real-world use cases
17 MIN READ/Sep 03, 2025

Every business today generates massive volumes of data, transactions, customer interactions, operations, supply chain activities, and more. Yet, for many organizations, this data remains underutilized. Traditional reporting methods, often confined to spreadsheets or static dashboards, tend to summarize what has already happened but rarely help leaders understand why it happened or what to do next.
This limitation has created a critical gap: decision-makers know what occurred but struggle to uncover the story behind the numbers or to act with agility. As industries become more competitive and data-driven, this approach often falls short. Organizations require insights that are faster, more predictive, and more dynamic than ever before.
That’s where Business Intelligence (BI) reporting steps in. Unlike traditional reporting, BI empowers organizations to analyze trends, visualize real-time data, and uncover patterns that drive proactive decision-making. Whether it’s enhancing customer experience, forecasting risks, or identifying growth opportunities, BI equips businesses with sharper tools to stay ahead.
Additionally, many organizations are discovering the value of business intelligence services and outsourcing solutions. These options allow companies to implement BI systems without overstretching internal resources, giving them access to expert support and faster transformation.
In this guide, we’ll break down Business Intelligence vs. Traditional Reporting, covering the key differences, benefits, and real-world use cases. We’ll also discuss practical strategies for transitioning from traditional methods, the role of outsourcing, and how BI can unlock real value for modern organizations.
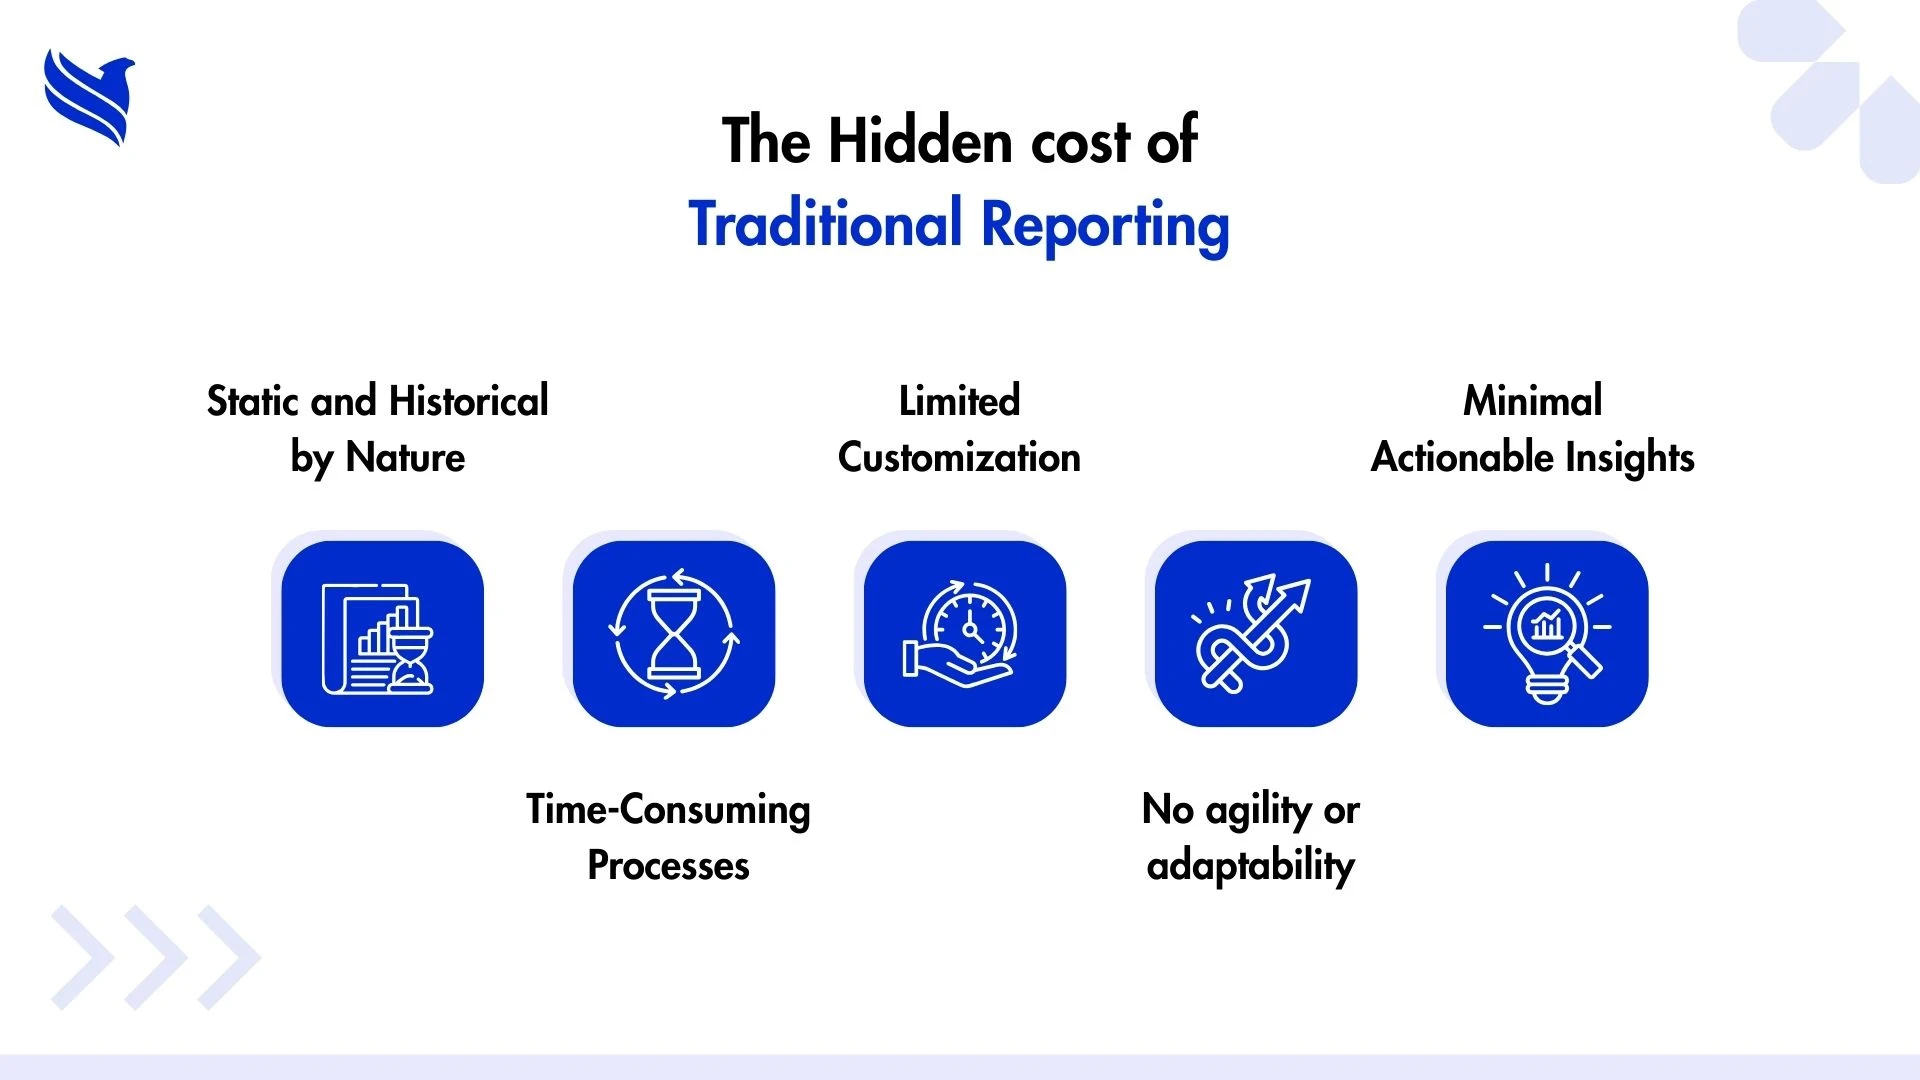
The hidden cost of traditional reporting
Traditional reporting has been the backbone of business decision-making for decades. However, as industries evolve and data complexity grows, its shortcomings are becoming increasingly evident. What once seemed sufficient now leaves companies struggling to keep pace. Let’s explore some of the core challenges.
Static and Historical by Nature
Traditional reporting tools are primarily backward-looking. They consolidate historical data into tables, charts, or PDFs that provide a snapshot of what has already occurred. While useful for compliance or record-keeping, this static approach does little to support proactive or predictive decision-making.
Imagine a retail business noticing declining sales in its latest monthly report. By the time the numbers are compiled, distributed, and reviewed, weeks may have passed. Opportunities to adjust pricing strategies, promotions, or supply chain issues in real-time are lost.
Time-Consuming Processes
Reports generated through manual data collection, consolidation, and formatting consume significant staff time. Analysts often spend hours cleaning data or reconciling discrepancies across systems before a single report can be shared.
This “reporting lag” means that managers often make decisions on outdated information. In industries where agility is crucial, such as finance, healthcare, or e-commerce, this delay can result in lost revenue, compliance risks, or operational inefficiencies.
Limited Customization
Traditional reporting systems are often rigid. Reports tend to follow fixed templates with little room for customization or interactivity. If executives need deeper insights, such as drilling down into specific regions, customer segments, or timeframes, analysts must create additional reports from scratch.
The lack of flexibility not only slows down responses but also creates dependency on specialized teams, widening the gap between data and decision-making.
Difficulty Handling Large Data Volumes
With the rise of big data, traditional reporting systems struggle to keep up. Massive data sets from multiple sources, social media, IoT devices, CRM platforms, ERP systems, often overwhelm legacy tools. This results in performance issues, incomplete analysis, or even overlooked insights.
Minimal Actionable Insights
Perhaps the biggest drawback is that traditional reporting tells you what happened but not why. Numbers appear in rows and columns, but the underlying drivers of performance remain hidden. As a result, leaders are left with more questions than answers, limiting the strategic value of reporting.
What is the difference between traditional reporting and business intelligence
The conversation around Business Intelligence vs. reporting often sparks confusion. Many business leaders assume that BI is simply an upgraded version of reporting, faster, more colorful, maybe with fancier dashboards. But in reality, the difference between traditional reporting and business intelligence runs much deeper.
Traditional reporting is like a rearview mirror, it tells you where you’ve been. Business Intelligence, on the other hand, is more like a GPS system. Not only does it show you where you are, but it also guides you toward where you need to go, suggesting multiple routes, predicting traffic, and helping you make real-time adjustments.
Let’s break this difference down more clearly.
1. Nature of Data
- Traditional reporting relies on structured, historical data. It answers questions like, What were last quarter’s sales? or How much did we spend on marketing in January?
- Business intelligence reporting goes further by integrating data from multiple sources, structured, semi-structured, and even unstructured. BI answers deeper questions like, Why did sales drop in Q1? or What can we expect for Q3 given current trends?
2. Scope of Analysis
- Traditional reporting is descriptive. It describes what happened, often in tabular or chart form.
- Business Intelligence is diagnostic, predictive, and prescriptive. It not only explains what happened but also uncovers why it happened, forecasts what might occur next, and suggests actions to optimize outcomes.
3. Interactivity
- Traditional reports are static. Once generated, they don’t change unless recreated. If leadership wants to drill down into a detail (say, performance by product line), a new report must be manually built.
- BI tools are dynamic and interactive. Users can filter data, explore visual dashboards, and drill down into layers of information, all in real time.
4. Decision-Making Impact
- Traditional reporting helps with compliance, performance tracking, and record-keeping. Its role is more supportive than transformative.
- BI plays a central role in decision-making. By turning raw data into actionable insights, BI enables executives to respond quickly to trends, reduce risks, and capitalize on opportunities.
5. Timeframe
- Traditional reporting usually runs on a fixed schedule, daily, weekly, monthly. By the time reports are ready, the information may already be outdated.
- BI provides real-time insights. Sales teams can track performance live, operations managers can monitor supply chain bottlenecks instantly, and marketers can pivot campaigns mid-flight.
In short, business intelligence vs. traditional reporting is not about speed or aesthetics alone, it’s about strategy. Traditional reporting is a look back. BI is a look forward.
And as industries increasingly recognize the power of data, businesses across sectors, from healthcare to retail to finance, are transitioning toward BI. In fact, organizations are now asking not just “What happened?” but “What should we do about it?” That’s the paradigm shift.
Unlocking the power – Key capabilities of business intelligence
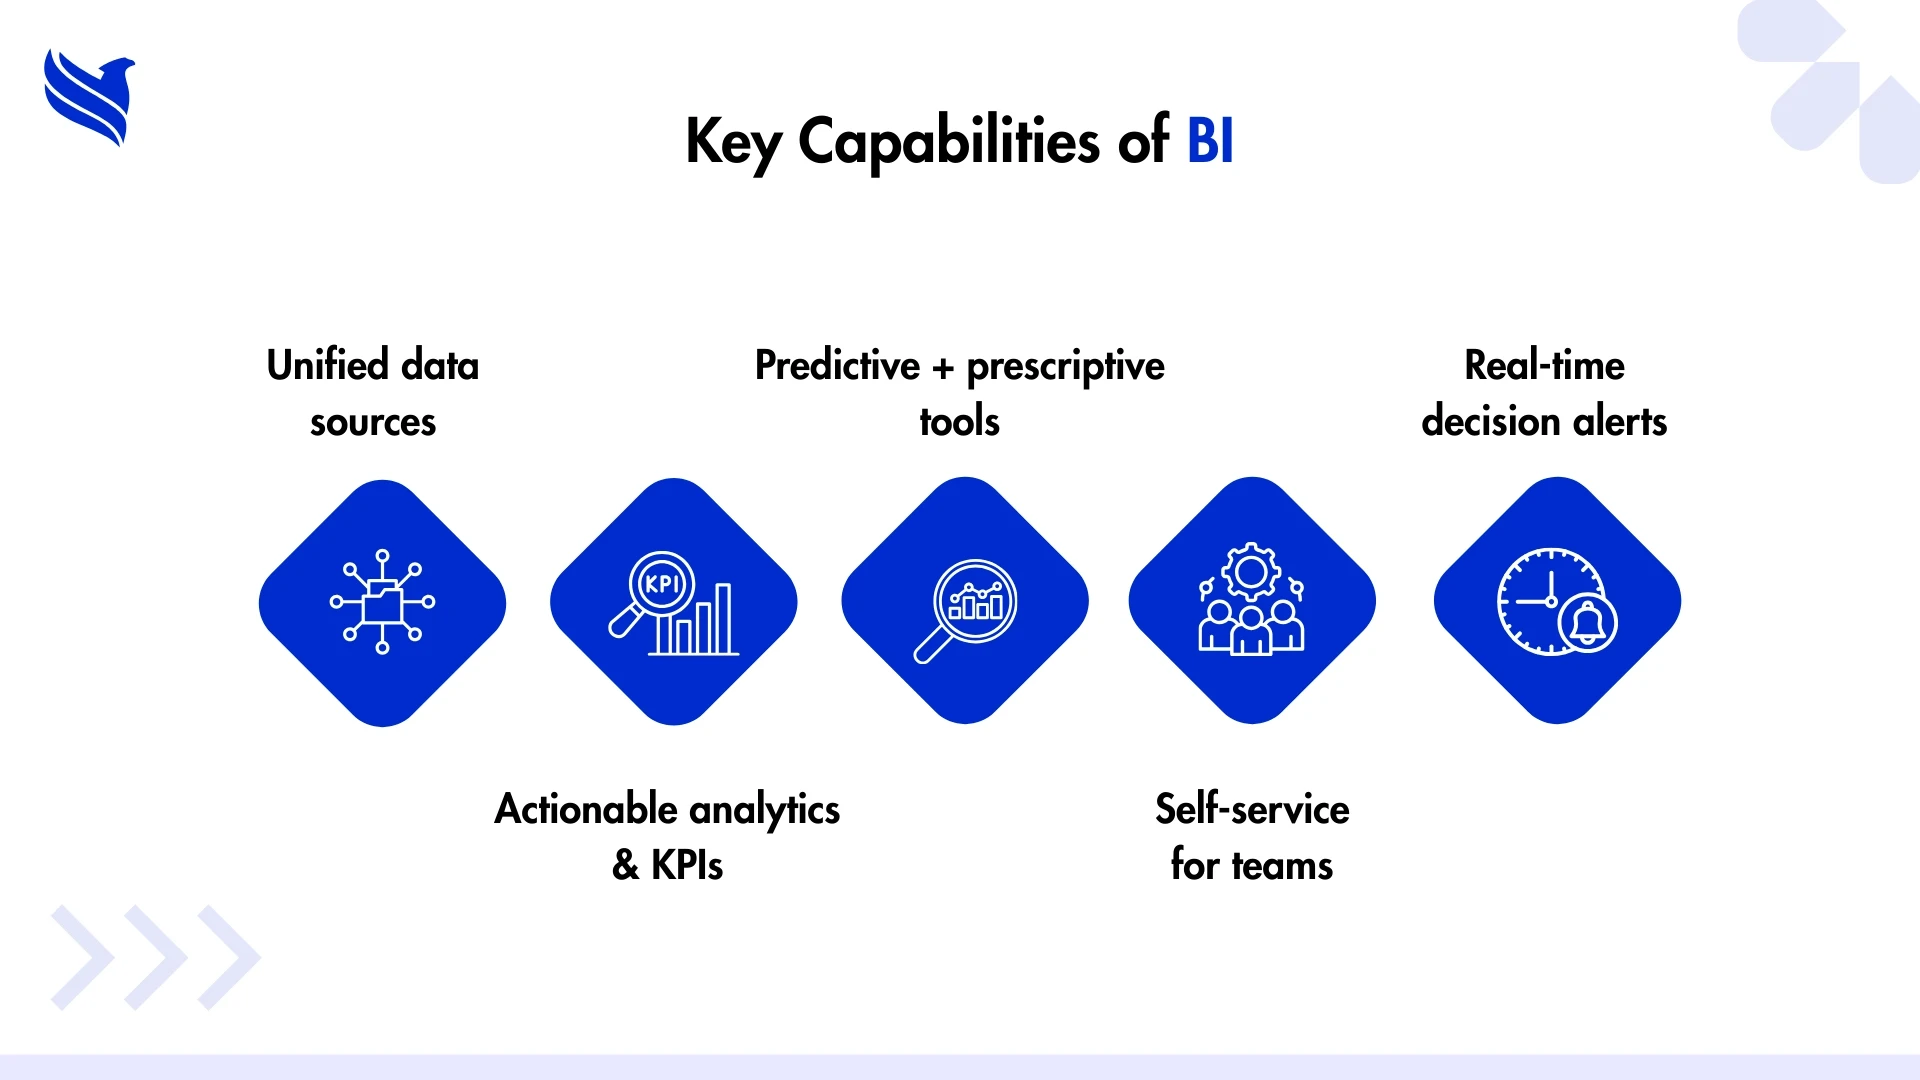
Now that we understand the difference between the two, let’s dig into the capabilities of business intelligence that make it so much more valuable than conventional reporting.
Think of BI as an ecosystem rather than a tool. It combines technology, processes, and expertise to ensure that data is not just collected but translated into meaningful action. Here are the core features that define modern BI.
Data Integration Across Systems
One of the biggest strengths of BI is its ability to pull data from multiple sources, ERP systems, CRM platforms, financial databases, marketing tools, and even IoT devices. Rather than relying on fragmented spreadsheets, BI consolidates everything into a single version of the truth.
This is particularly important in industries where data lives in silos. For example, in insurance, claims, underwriting, and customer service often operate on separate platforms. With BI, all of this data can be viewed in one dashboard, creating a holistic picture of operations.
Advanced Data Visualization
Unlike traditional reports filled with rows of numbers, BI leverages charts, heat maps, and interactive dashboards that simplify complex information. Visualization helps decision-makers spot patterns quickly, like a sudden sales spike in one region or rising support tickets in another.
Visualization also supports storytelling. Instead of presenting executives with 40 pages of spreadsheets, a BI dashboard can visually highlight the most critical trends in a matter of seconds.
Predictive Analytics
While traditional reporting tells you what already happened, BI incorporates predictive analytics to estimate future outcomes. For example, a retail chain can use BI to forecast demand for certain products during holiday seasons, or a bank can predict potential loan defaults based on customer behavior.
This forward-looking capability turns BI into a proactive decision-making tool.
Real-Time Monitoring
BI tools can deliver live updates, alerting teams to anomalies as they occur. For instance, if a healthcare provider sees an unusual increase in patient wait times, managers can intervene immediately rather than waiting until end-of-month reports reveal the problem.
This capability is crucial in industries where speed equals savings, or even lives.
User Empowerment & Self-Service
One of the game-changing features of BI is its ability to empower non-technical users. With intuitive dashboards and drag-and-drop functionality, managers, sales reps, or operations staff can access insights without relying heavily on IT or data analysts.
This democratization of data reduces bottlenecks and fosters a culture of data-driven decision-making.
Scalability and Customization
Unlike rigid traditional systems, BI solutions can scale with organizational growth. Whether you’re a startup analyzing a few thousand data points or an enterprise processing millions daily, BI tools adapt to fit your needs. Reports and dashboards can also be customized to specific teams, roles, or strategic goals.
Collaboration and Sharing
Modern BI platforms also emphasize collaboration. Teams can share dashboards, annotate findings, and collaborate in real-time, ensuring that insights are not locked in silos but actively drive organizational alignment.
In essence, what is traditional business intelligence versus modern BI tools comes down to evolution. Earlier BI systems functioned more like reporting engines, still bound by historical data. But today’s business intelligence services combine automation, AI, machine learning, and visualization to deliver a far more powerful, real-time decision-making environment.
This shift has enabled BI to support industries in new ways. In fact, BI adoption has expanded far beyond the tech or finance sectors, today, industries from healthcare to manufacturing are benefiting by leveraging BI to improve operations, efficiency, and customer engagement.
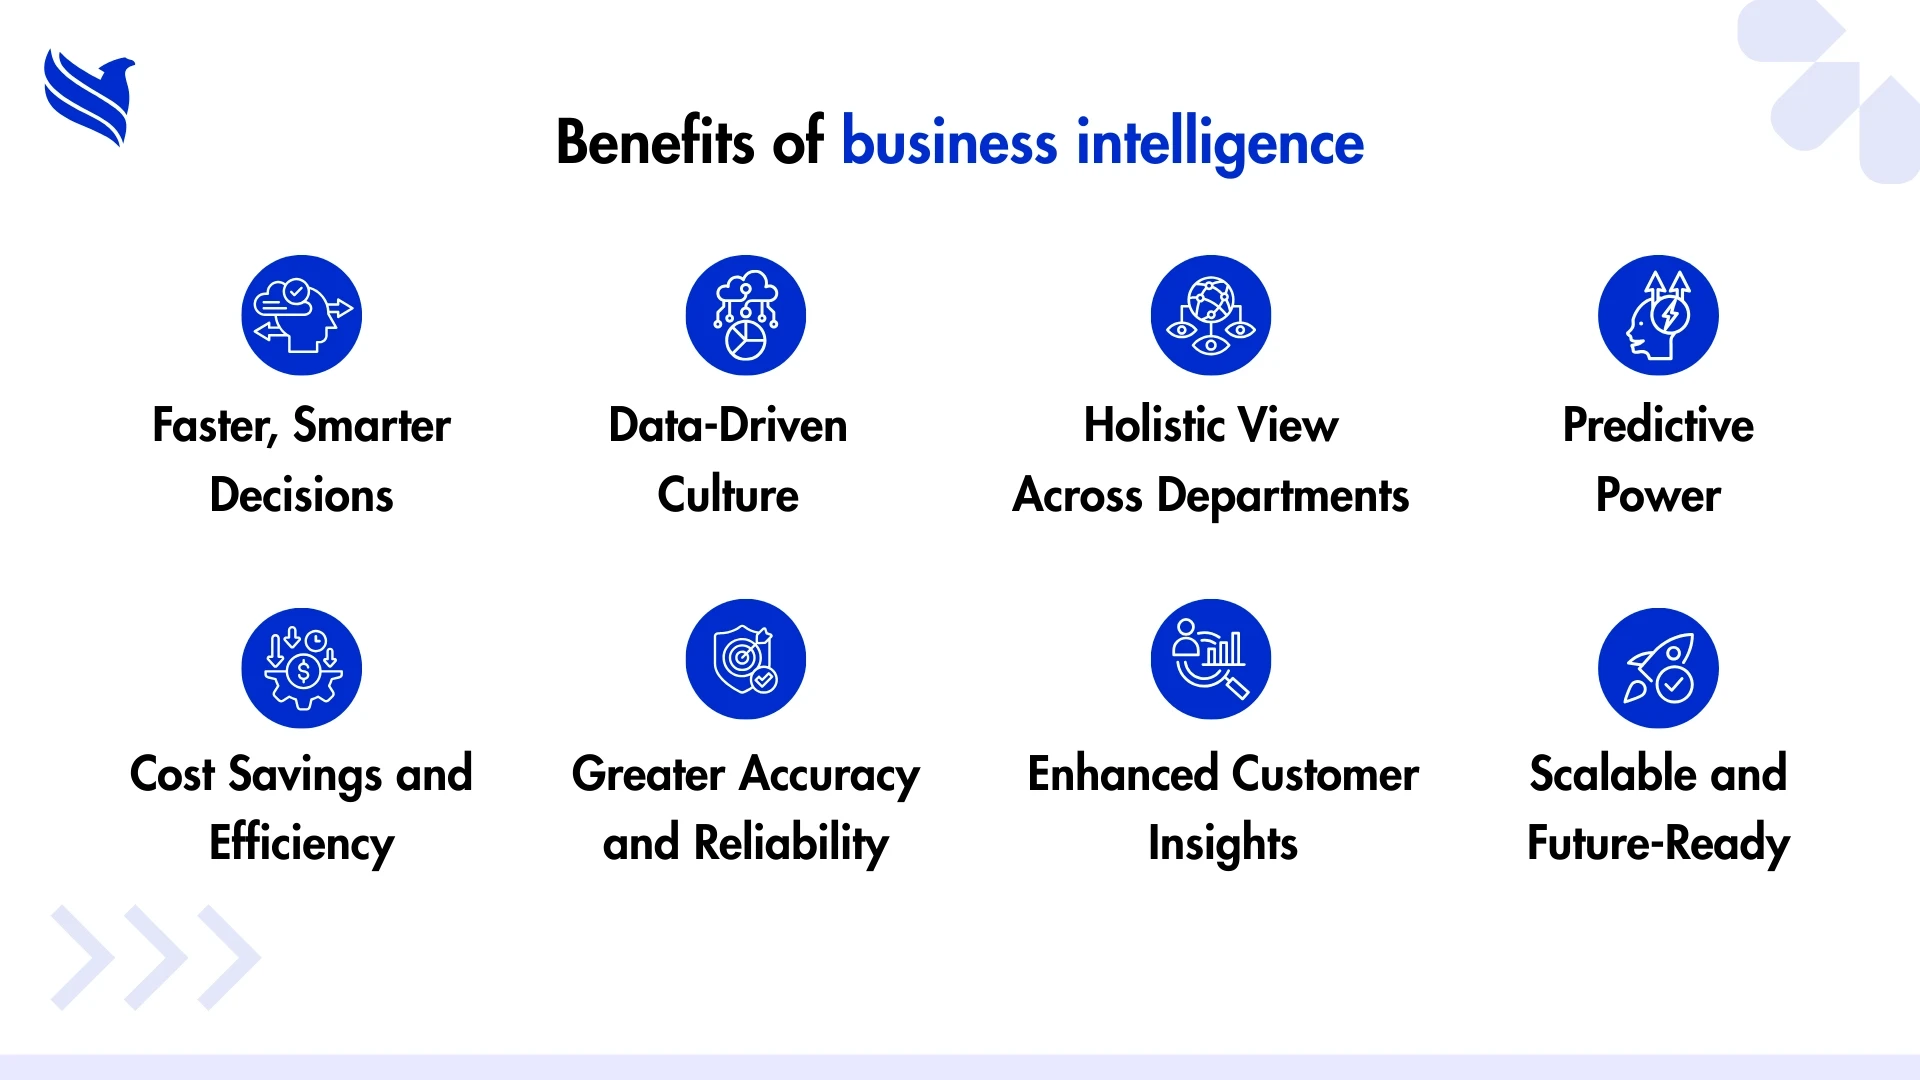
Understanding the difference between traditional reporting and business intelligence is one thing, but seeing how BI drives real-world advantages is another. The shift isn’t just about upgrading tools; it’s about transforming the way businesses think, act, and grow. Here are some of the most compelling benefits of BI compared to traditional reporting.
Faster, Smarter Decisions
In traditional environments, decision-making often lags because leaders rely on scheduled, static reports. By the time a report reaches the decision-maker’s desk, the data may already be outdated.
With business intelligence reporting, decision-makers get real-time insights. A marketing manager, for example, can see how a campaign is performing live and tweak strategies instantly. This agility can be the difference between seizing an opportunity and missing it.
Data-Driven Culture
Traditional reporting keeps data in the hands of a few, usually analysts or IT staff, who then create reports for others. BI, however, democratizes data. With intuitive dashboards and self-service features, employees at every level can access and interpret information.
This builds a culture of data-driven decision-making, where everyone from frontline staff to executives can contribute to smarter choices.
Holistic View Across Departments
One of the biggest frustrations with traditional reporting is data silos. Marketing works with one set of numbers, finance with another, operations with yet another. This fragmented view makes it hard to connect the dots.
BI eliminates silos by integrating data from multiple systems into a single source of truth. Suddenly, sales teams can see how customer behavior impacts revenue, or HR can connect employee engagement metrics to productivity outcomes. The organization moves from “guessing in silos” to “acting as one.”
Predictive Power
Traditional reports are like a snapshot album of the past; BI is more like a live movie with future scenes hinted at. Through predictive analytics, BI tools can forecast outcomes, identify risks, and even recommend actions.
For instance, a retail chain can predict which stores are likely to run out of inventory next week and take preventive steps. A healthcare provider can anticipate patient surges during flu season. These predictive insights help organizations stay one step ahead.
Cost Savings and Efficiency
Manual reporting processes are time-consuming and resource-intensive. Employees may spend hours collecting, cleaning, and reconciling data, time that could be used for higher-value tasks. BI automates much of this work, cutting down labor costs and minimizing errors.
Beyond cost savings, BI helps organizations allocate resources more efficiently. For example, by analyzing service usage trends, a telecom company can optimize staffing, reducing overtime costs.
Greater Accuracy and Reliability
Human error is one of the biggest risks in traditional reporting. A missed formula in a spreadsheet or a copy-paste mistake can distort decision-making. BI tools reduce this risk by automating data collection and standardizing calculations.
When executives know they’re working with accurate, real-time data, confidence in decisions skyrockets.
Enhanced Customer Insights
BI goes beyond operational metrics, it helps businesses understand their customers better. By analyzing purchasing behavior, feedback, and engagement patterns, BI uncovers what customers truly want.
This enables personalized marketing, better service delivery, and improved product development. In today’s customer-first economy, these insights are invaluable.
Scalable and Future-Ready
Unlike traditional systems that require manual scaling, BI solutions grow with your business. As data volumes increase or new systems are added, BI platforms adapt without disrupting operations. This scalability makes BI a long-term investment in competitiveness.
In short, BI doesn’t just improve reporting, it reshapes business outcomes. The leap from traditional reporting to business intelligence is about moving from hindsight to foresight, from static summaries to dynamic strategies.
Practical steps for evolving from traditional reporting to BI
Knowing the benefits of BI is inspiring, but for many businesses, the big question remains: How do we actually make the switch from traditional reporting to BI without disrupting daily operations?
The good news: transitioning is achievable with the right strategy. Let’s explore the practical steps organizations can take.
Step 1: Assess Current Reporting Limitations
Start by asking: What frustrates us most about our current reporting? Is it the lag time? The lack of interactivity? The siloed data? Documenting these challenges helps define the business case for BI and creates a roadmap for implementation.
Step 2: Define Clear Goals
Transitioning to BI should not be a technology-first exercise. Instead, focus on business goals. Do you want faster decision-making? Better customer insights? Real-time visibility into operations? By setting objectives, you ensure the BI solution aligns with organizational priorities.
Step 3: Choose the Right BI Platform
There are numerous BI tools in the market, Power BI, Tableau, Qlik, and more. Choosing the right one depends on your company’s size, budget, technical expertise, and scalability needs. Some platforms excel in visualization, while others integrate seamlessly with ERP or CRM systems.
This is where business intelligence services and support providers often step in. Their expertise helps businesses select and configure the most suitable tool for their unique context.
Step 4: Ensure Data Quality and Integration
A BI system is only as good as the data feeding it. Before implementation, organizations should audit data sources, clean inconsistencies, and set up processes for ongoing data governance.
Integration is equally important. Linking ERP, CRM, HR, and financial systems ensures BI delivers a comprehensive view rather than fragmented insights.
Step 5: Start Small, Scale Gradually
Rather than attempting a full-scale transformation on day one, businesses often succeed by piloting BI in one department or use case. For example, start with sales performance tracking or customer analytics. Once the pilot proves value, scale BI across other departments.
This phased approach reduces risk and helps build confidence across the organization.
Step 6: Empower Users with Training
One of the keys to BI adoption is empowering end-users. Even the best tool will fail if people don’t know how to use it. Conduct training sessions, create user-friendly dashboards, and encourage teams to explore BI independently.
Remember, BI isn’t about replacing employees with technology, it’s about enabling them to work smarter.
Step 7: Leverage Outsourcing Where Needed
For many companies, the transition can feel overwhelming. Outsourcing to specialists provides access to business intelligence outsourcing solutions that accelerate deployment, manage complexities, and ensure smooth adoption. From setup to ongoing support, outsourcing partners often bridge gaps in expertise.
Step 8: Measure Impact and Iterate
After implementation, track whether BI is delivering on your initial goals. Are decisions being made faster? Are teams more empowered? Use KPIs to measure success and make iterative improvements.
Transitioning from traditional reporting to business intelligence isn’t a one-time project, it’s an evolution. With the right approach, companies can shift from reactive reporting to proactive intelligence, gaining the insights needed to compete in today’s fast-paced markets.
It’s also worth noting that the transition pays off across sectors. For example, as highlighted in our resource on the power of data management and reporting, BI can redefine how organizations capture, process, and use data to drive smarter outcomes.
Why people struggle to move beyond traditional reporting
While the technical side of BI transformation often gets attention, the human factor is equally important. Many employees are comfortable with spreadsheets and static reports, and shifting to interactive dashboards or predictive analytics can feel intimidating.
Resistance often stems from three areas: fear of technology, lack of training, and uncertainty about how BI will affect roles. Employees may worry that automation will replace them or that they’ll lose control over familiar processes.
The key to overcoming this lies in communication and inclusion. Leaders should emphasize that BI is not about replacing jobs but about enabling smarter, faster decisions. Providing training, showcasing early wins, and involving teams in dashboard design helps build confidence.
Organizations that actively manage change, through workshops, clear messaging, and ongoing support, tend to see higher adoption rates. By tackling resistance early, businesses ensure BI becomes an enabler, not a disruptor.
The outsourcing advantage – how external expertise accelerates BI success
Not every company has in-house expertise to manage BI implementation, integration, and support. That’s where business intelligence outsourcing solutions come into play. By partnering with experienced providers, organizations access specialized knowledge without overburdening internal teams.
Outsourcing offers three main advantages:
- Speed: Experts can deploy BI tools faster, shortening the time to value.
- Cost Efficiency: Instead of hiring full-time specialists, companies pay only for the expertise they need.
- Ongoing Support: Providers often include business intelligence support services such as system monitoring, updates, and user training.
For growing businesses, outsourcing is especially valuable, it levels the playing field by making cutting-edge BI accessible without the overhead. Outsourcing partners also help identify blind spots, integrate multiple data systems, and customize dashboards for strategic goals.
In short, outsourcing reduces complexity and maximizes ROI, ensuring BI adoption becomes a smooth journey rather than a technical headache.
Conclusion: Why now is the time to embrace BI
The debate of Business Intelligence vs. Traditional Reporting isn’t just academic, it’s strategic. Companies that continue relying solely on static, backward-looking reports risk falling behind in fast-moving markets. BI offers not only agility but also foresight, enabling leaders to pivot quickly, seize opportunities, and stay competitive.
The transition is not without challenges, but the rewards, greater efficiency, deeper customer understanding, and improved decision-making, are worth the effort. And businesses don’t need to do it alone. Partnering with trusted providers like FBSPL, which offers comprehensive business intelligence services and support, ensures organizations can implement BI smoothly and cost-effectively.
At the end of the day, BI isn’t about replacing traditional reporting, it’s about elevating it. By combining both, businesses can track the past while planning the future with clarity.
Ready to move beyond static reports and unlock actionable insights? Get in touch with FBSPL today to explore how our business intelligence outsourcing solutions can empower your organization to transform data into results.
Call and get a 15 min free BI consultation.
Expert Contributor
Insights and analysis from our industry experts.

.png&w=3840&q=75)

