
How you can use Power BI for best analytical solution
6 MIN READ/Apr 30, 2025

If you are trying to make sense of your cluttered data without spending hours with unstructured spreadsheets, Power BI might help you overcome this situation. Power Bi is a powerful tool designed to provide effective data visualizations that help you transform raw data into meaningful insights, fast, easy, and with style.
So, whether you are a business owner, a data analyst, or someone who just wants to make data more appealing to make smarter decisions, this blog is for you. Here, we will learn about how to use Power BI, its key features, and the benefits it brings to businesses and process analysts alike.
What Is Power BI?
In simple language, Power BI is a suite of business analytics tools helping users analyze their company data and share feedback in real time using interactive dashboards and reports. It connects together a number of large data sets and turns it into a visual spectacle that later helps your organization make organizational decisions.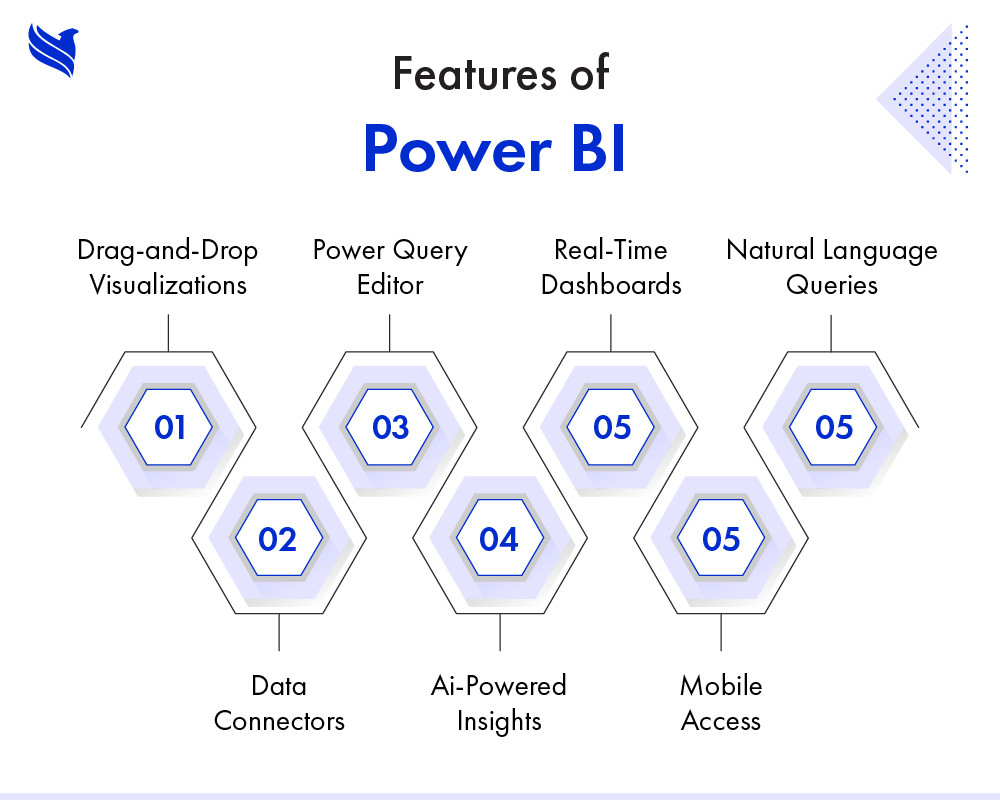
Key features of Power BI
There is an array of tasks you can perform using Power BI, but making sense of unstructured data is what makes it stand out. It is not just a reporting tool, as it is equipped with functions that simplify data analysis for everyone:
- Drag-and-drop visualizations: Build beautiful charts, maps, KPIs, and dashboards without writing a line of code.
- Data connectors: Integrate with Excel, SQL, SharePoint, Google Analytics, Salesforce, and more.
- Power query editor: Clean, shape, and transform data right within the tool.
- AI-powered insights: Use built-in AI visuals like key influencers, smart narratives, and forecasting.
- Real-time dashboards: Monitor live metrics with automatic data refresh.
- Mobile access: Stay in control of your business with dashboards on your phone or tablet.
- Natural language queries (Q&A): Ask questions like “show sales by region” and get instant visual answers.
Challenges businesses face when implementing Power BI
Despite its ability to create a deep impact on decision-making processes, Power BI comes along with a set of obstacles that we need to address. So, here are some common challenges businesses face while implementing Power BI:
1. Data quality issues
No matter how much you filter data, it is still bound to have some quality issues. Poor data quality, including uneven formatting or missing fields, can affect your final decision making. Therefore, without precise data, even the top BI tools like Power BI will produce inaccurate results.
2. Lack of data literacy
Training staff with the latest tools and technologies is a must for every organization. As pre-trained employees cannot create effective data visualizations, it is highly essential for companies to develop a culture of regular staff training to efficiently use Power BI.
3. Integration complexities
Staying connected with multiple sources of data at the same time is almost impossible, especially in legacy systems, therefore businesses should devise a plan to improve their integration capabilities.
4. High initial setup time
One of the biggest challenges for businesses while implementing BI tools is setting up dashboards, defining KPIs, and building data models. The initial set up can sometimes be overwhelming, especially without a clear BI strategy.
5. Data governance and security
With time, company data becomes more accessible for different departments within the organization. Therefore, businesses must put strict governance and security policies so that there are no data leaks and compliance issues.
6. Resistance to change
Teams using traditional methods of extracting and managing data may find it difficult to adopt new technologies and tools. This resistance can result in delays and errors.
How do you use Power BI?
Finding a BI tools most suited for your existing workflow might take time, but getting started with Power BI is easier than you might think. Here’s a simple breakdown:
- Connect to your data: Use built-in connectors to import data from Excel, cloud services, databases, APIs, and more.
- Clean and transform your data: Use Power Query to remove duplicates, merge tables, and create custom columns, no need for complex formulas.
- Build your reports and dashboards: Drag and drop visuals to tell the story of your data. Add filters, slicers, and drill-through options for interactivity.
- Publish and share: Share your reports via the Power BI service. Collaborate with teams using Microsoft Teams or embed dashboards into your apps.
- Monitor and refresh: Power BI has a schedule automatic refresh function to keep your dashboards up to date with the latest data.

Benefits of Power BI
One of the biggest benefits of using Power BI is that it helps businesses make data-driven decisions with real time insights. Using Power BI brings a wide range of benefits to organizations of all sizes:
1. Improved decision-making
Power BI turns complex data into easy-to-understand visuals, making it easier for stakeholders to take action based on real-time insights.
2. Time savings
Automate report generation and updates, saving analysts and teams countless hours every week.
3. Cost-effective
Power BI offers a free desktop version and reasonably priced professional plans, making advanced analytics accessible for all.
4. Data centralization
No more jumping between platforms. Combine multiple data sources into one dashboard to get a 360° view of your operations.
5. Enhanced collaboration
Share reports securely across departments and teams. Everyone stays on the same page, literally.
How Power BI benefits business and process analysts?
For business analysts and process improvement pros, Power BI is more than a dashboard tool — it’s a decision-making accelerator.
For business analysts:
- Spot trends & patterns: Visualize historical and current data to uncover trends that drive strategy.
- Build what-if scenarios: Create simulations to test different strategies and predict outcomes.
- Combine KPIs in one place: Track sales, marketing, finance, and customer metrics on a single dashboard.
For process analysts:
- Analyze workflow bottlenecks: Use process data to identify slowdowns, delays, or inefficiencies in real-time.
- Monitor key process indicators: Set up alerts and triggers when performance drops below target.
- Support continuous improvement: Validate process changes with data-backed insights and measure improvement over time.
In short, Power BI enables analysts to go from data gathering to impact analysis quickly and with clarity.
Make smarter decisions with Power BI
Now as we have discussed the features and benefits of Power BI, we hope this blog can help you in making an informed decision. So, if you are not already using Power BI, now's a great time to explore how it can make your data journey much smoother. If you're unsure where to begin, need help with setup, or want to train your team, we are here to help!
At FBSPL, our experts help businesses harness the full potential of Power BI so that they can make smarter decisions, improve efficiency, and uncover growth opportunities. Contact us today for more info.
Expert Contributor
Insights and analysis from our industry experts.